Multivariate Data Analysis
Build, deploy and live-monitor PCA and PLS models for batch manufacturing.
My Contribution
- Collaborated with Customer Success and Sales to understand our end users and to define the production strategy and scope of the application.
- Created and maintained the PRD of the application
- Built the information architecture of the entire application
- Designed the low fidelity wireframes
- Reviewed the high fidelity wireframes and mockups built by our Product Designer
- Used Cursor AI to develop an application to create and maintain the various data visualisations with High Charts in VanillaJS
Timeline
4 months
Outcomes
- Secured a Global Pharmaceutical company as a client with intent to scale across multiple sites, directly contributing to revenue.
- Usage metrics at the Global Pharmaceutical company
- Improvement in Lead Generation
RESEARCH
User Research
End users
Model building and model monitoring are the 2 use cases of the application. Data Analysts and Scientists are expected to build and deploy the models. Business and Process Engineers are expected to monitor the model performance along with the actual production. The end users are fairly proficient with ERP software, so UX complexity won’t be an issue.
Application expectations
Primarily, users should be able to build, deploy and monitor PCA and PLS models. They should also be able to filter and transform the datasets used for building the aforementioned models. True value would be provided with the improvement and optimisation of their batch production metrics. Those metrics could be yield, quality, throughput or any other measurement.
User Needs
Data extraction
Quick creation and manipulation of training datasets capturing batches and features processed for a product.
Flexibility
Making non-linear workflows is critical. User may want to create multiple models from the same dataset.
Exploratory workflows
Users should be able to explore, filter and transform the data. They should be able to do group analysis for PCA models.
Intuitive, interactive visualisations
Intuitive visualisations are non-negotiable. They need to be interactive, such as, zoom, batch selection and group analysis.
Information packed
Showing dataset statistics, detailed visualisation hover tooltips and model performance are some examples.
Live monitoring
Would be for a larger user base. Timely updates of the live batch and comparing scored batches are some examples.
Pain Points of Version 1.0
Data support, preparation and analytics
- No support for customising granularity of data
- No support for Discrete and Spectral data
- No support for string or boolean data types
- Lack of comprehensive data cleaning capability
- Lack of dataset statistics
- No support for PCA Models
- All PLS models have hard-coded 2 latent variables


User Experience
- Ineffective visualisation types and layouts
- Linear workflow causes back and forth between steps
- Lack of effective visualisation interactions
- Lack of support for group-to-group comparison
- Ineffective model monitoring workflow
- Situations where UI components break
Competitive Analysis of SIMCA
What we have over SIMCA
- Price of the product is substantially lower
- Users are able to build models on batch data processed on the platform rather than extracting and uploading spreadsheets
- Users are able to deploy the model on the platform to process and monitor live batches
- Similar quality and legibility of visualisations
What SIMCA has over us
- Significantly larger team with a global presence
- Not browser-based, better equipped to handle large volumes of data
- More comprehensive toolset for data preparation and transformation

The Solution
Overhauling the existing version into a robust application with non-linear workflows enabling users to build, deploy and monitor models to improve the batch manufacturing of their products.
Models will support data which is either time series, discrete, spectral or a combination. They will support numeric and categorical data types.
Scope
Phased approach
Due to its scale of the application, it was decided unanimously that a phased approach would be ideal.
Phase 1 of the application was finalised as:
- Enabling users to create datasets by either fetching it from the platform or uploading CSVs
- Enable Dataset creation for Operation, Phase and Phase Step nodes of a Recipe
- Enabling users to build, deploy and monitor PCA models for either time series, discrete or spectral data
- Enabling users to build, deploy and monitor PLS models for time series data
- Supporting numeric, string and boolean data formats
Future phase
- Enabling users to build, deploy and monitor PLS models for discrete data
- Additional data transformation capability
- Support for other model types
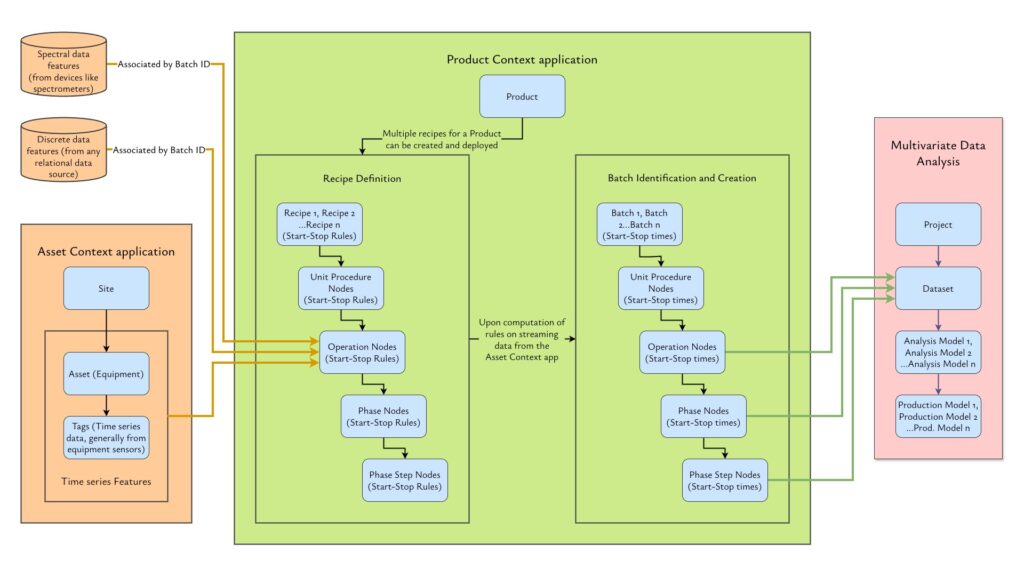
Information architecture
How it works
Lorem ipsum dolor sit amet, commodo erat adipiscing elit. Sed do eiusmod ut tempor incididunt ut labore et dolore.
Terminology
Products
Originate from Quartic’s Product Context application. Multiple recipes can be configured for a single product, which upon computation of streaming data creates Batches of the Product.
Recipes
Originate from Quartic’s Product Context application. Recipes are a tree of steps that every batch goes through for manufacturing a specific product.
Batches
Showing dataset statistics, detailed visualisation hover tooltips and model performance are some examples.
Features
Would be for a larger user base. Timely updates of the live batch and comparing scored batches are some examples.
Projects
A workspace for users to create Datasets, filter or transform them, build PCA and/or PLS Models from Datasets and eventually deploy them.
Datasets
Training datasets for models created from batch data extraction or CSV uploads. Datasets can be filtered and transformed once created.
Analysis Models
Models created from datasets in a Project. This is an exploratory space where the user can tweak Model settings, perform group-to-group analysis and select training batches for the model. Once deployed, an Analysis Model becomes a Production Model.
Production Models
This is a deployed PCA or PLS Model. The only requirement to deploy a model is to select a minimum of 3 batches as the training set. Once deployed, the model computes data of the new batches built from the Dataset’s underlying Recipes.
User flows
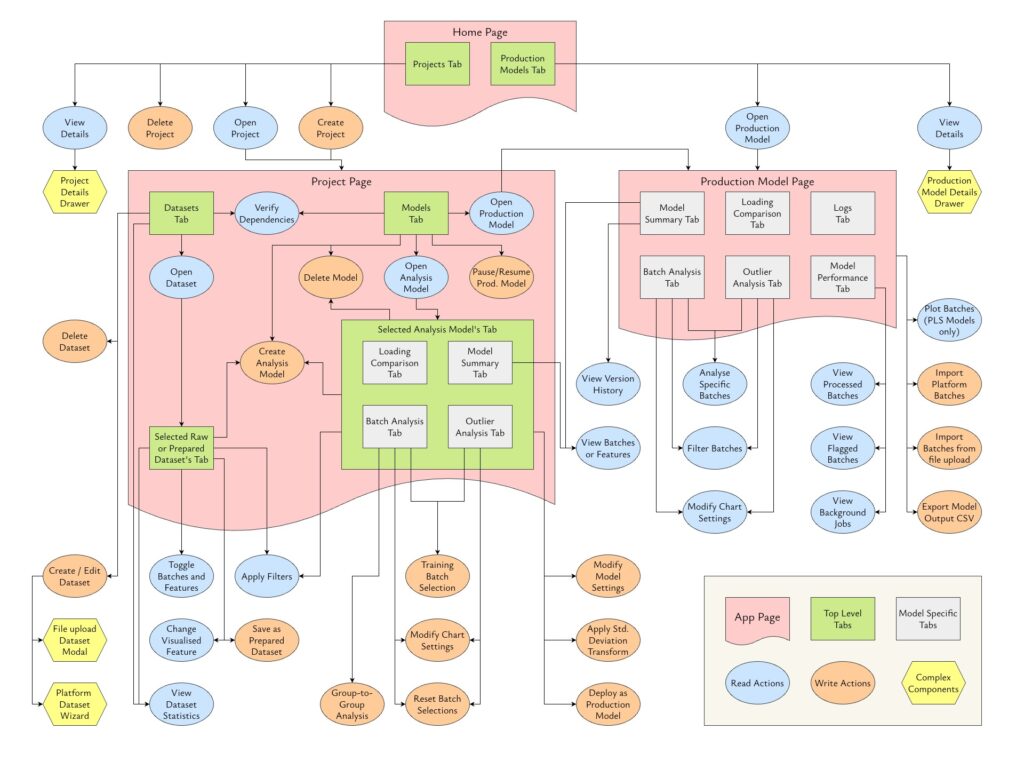
Projects
Create, Rename, Open, View Details, Delete
Datasets
Create from platform data, Create from file upload, Edit, Open, View Statistics, Filter, Save as Prepared Dataset, Delete
Analysis Models
Create Model, Edit Model Settings, Filter, Transform, Group-to-group Analysis, Training Batch Selection, Deploy, Delete
Production Models
Open, Import Batches, Export as CSV, Filters
Design
Pages and Layouts
Home Page
This is a common page for both user types.
Project Page
Integer enim risus suscipit eu iaculis sed ullamcorper at metus. Venenatis nec convallis magna eu congue velit. Proin varius libero sit amet tortor volutpat diam tincidunt.
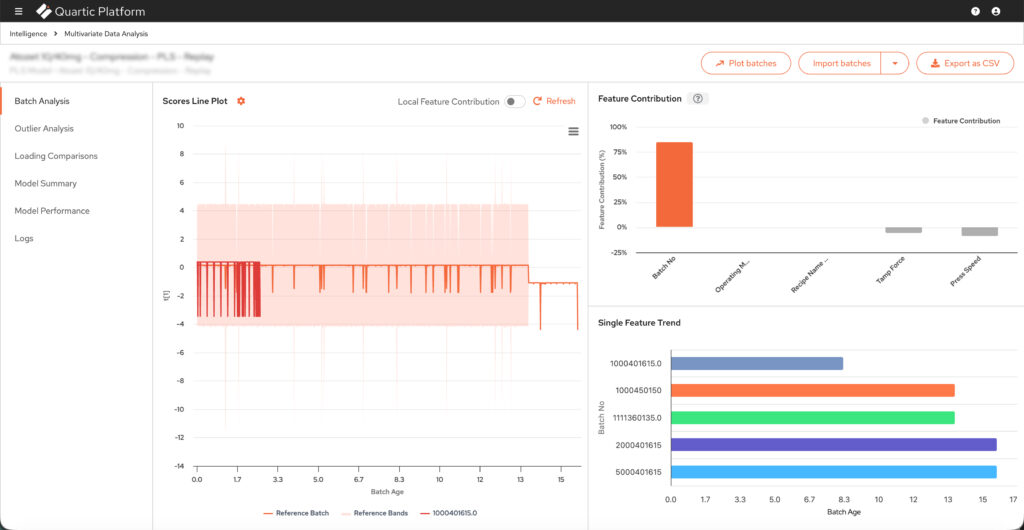
Production Model Page
Integer enim risus suscipit eu iaculis sed ullamcorper at metus. Venenatis nec convallis magna eu congue velit. Proin varius libero sit amet tortor volutpat diam tincidunt.
Important design components
First item
Lorem ipsum dolor sit amet, commodo erat adipiscing elit. Sed do eiusmod ut tempor incididunt ut labore et dolore.
Second item
Integer enim risus, suscipit eu iaculis sed, ullamcorper at metus. Venenatis nec convallis magna, eu congue velit.

Third item
Aliquam tempus mi nulla porta luctus. Sed non neque at lectus bibendum blandit. Morbi fringilla sapien libero.
Visualisation Assets
Using Cursor AI, I created a NodeJS + VanillaJS project to manage all the visualisation assets. The Design team used it to populate the mockups with chart images. The Engineering team used it to maintain a consistent look and interaction with the designs.